The number of days available to complete land-based agricultural activities influences decisions about inputs, such as variety/hybrid planted and pesticide used, and machinery. The limited fieldwork days available for completing crucial tasks — such as tillage, planting and harvest — require careful management.
A large machinery complement will complete fieldwork quickly but can increase ownership costs. A small machinery complement may have lower ownership costs but may also delay some key activities that affect productivity. The size of machinery needed to efficiently complete the necessary activities depends on how many days the machinery can actually be used in the field.
From 1977 to 2017, the United States Department of Agriculture (USDA) National Agricultural Statistics Service (NASS) reported the number of days each week that soil and moisture conditions were suitable for fieldwork. These data start around the first week of April. This start date leaves a gap in fieldwork days data when important field operations such as fertilizer application and early corn planting occur.
Average number of days suitable for fieldwork
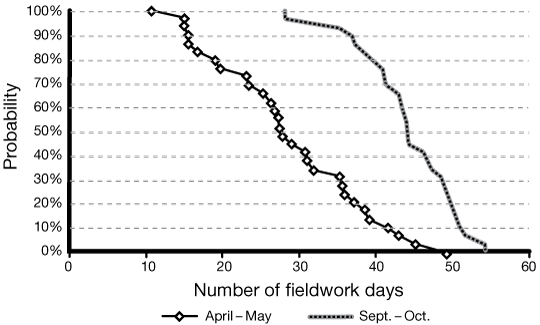
Figure 1 shows the distribution of fieldwork days for the periods of April–May and September–October. Use the graph by selecting the number of days that you would like to have available for fieldwork. Draw a straight line up. When your line intersects either the April–May or September–October plots, draw a straight line left to the axis labeled “Probability.” The result is the percentage of time that you could expect the desired number of fieldwork days to be available. For example, 35 fieldwork days or more occur about 30 percent of the time during the April–May period. This means that 70 percent of the time less than 35 fieldwork days are available.
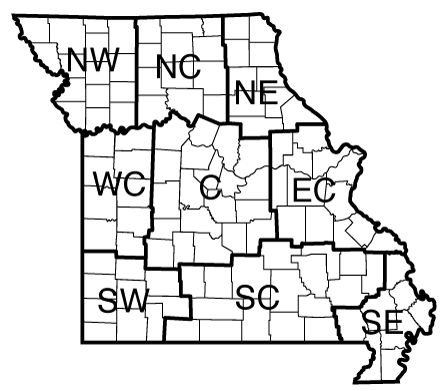
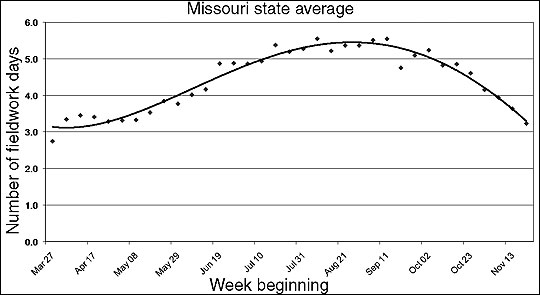
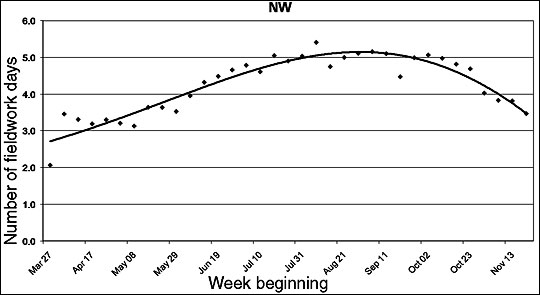
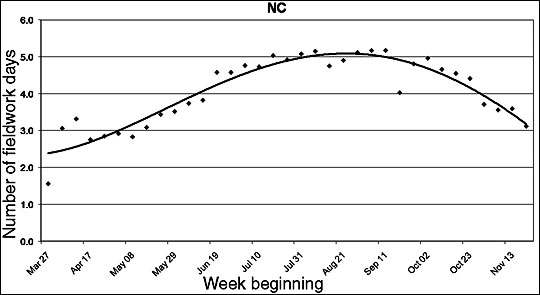
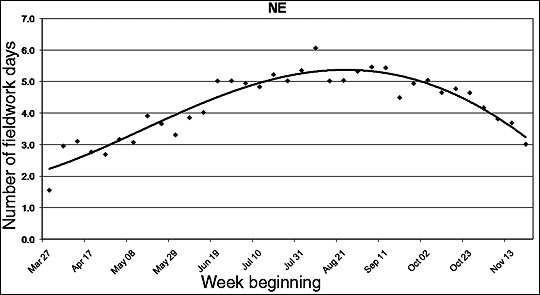
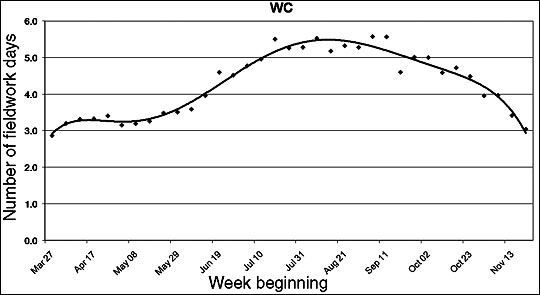
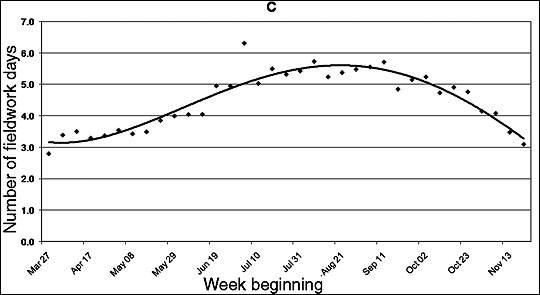
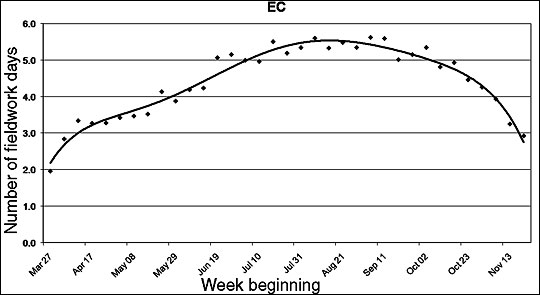
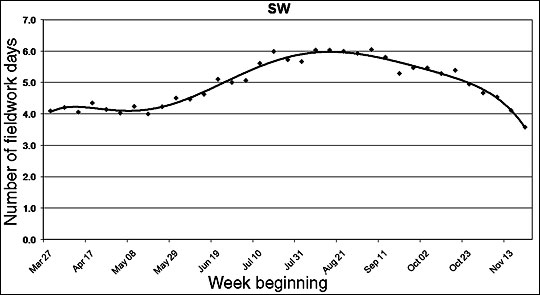
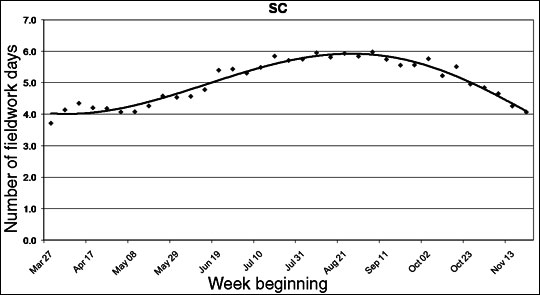
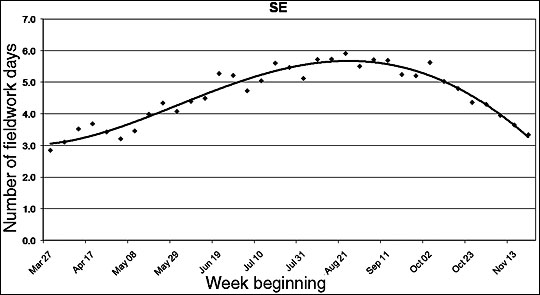
Table 1 summarizes the average number of weekly fieldwork days from 1977 to 2015 in each of the nine NASS regional reporting districts. The actual number of suitable fieldwork days varies considerably from year to year. Estimates are for seven-day workweeks. If fieldwork will not be done every day of the week, adjust the data by multiplying by the fraction of the week that will be worked, such as 6/7 or 0.857 for a six-day workweek. Figure 2 identifies the grouping of counties for each Missouri district. Figure 3 shows the weekly averages for each district with a trend line to smooth out the weekly variability.
Table 1. Average number of days per week for fieldwork in Missouri.
| Week beginning | Missouri Agricultural Statistics Service reporting districts | Missouri state | ||||||||
|---|---|---|---|---|---|---|---|---|---|---|
| NW | NC | NE | WC | C | EC | SW | SC | SE | ||
| Mar 27 | 3.6 | 1.4 | 0.9 | 2.6 | 2.4 | 1.7 | 4.0 | 4.3 | 3.4 | 2.9 |
| Apr 03 | 3.3 | 2.5 | 2.5 | 3.2 | 3.0 | 2.6 | 4.1 | 4.1 | 3.0 | 3.0 |
| Apr 10 | 3.4 | 3.0 | 2.9 | 3.3 | 3.4 | 2.9 | 4.3 | 4.2 | 3.1 | 3.3 |
| Apr 17 | 3.3 | 3.1 | 3.1 | 3.2 | 3.3 | 3.3 | 4.1 | 4.3 | 3.4 | 3.4 |
| Apr 24 | 3.0 | 2.7 | 2.8 | 3.3 | 3.3 | 3.3 | 4.4 | 4.3 | 3.6 | 3.4 |
| May 01 | 3.3 | 2.9 | 2.7 | 3.3 | 3.3 | 3.3 | 4.2 | 4.1 | 3.5 | 3.3 |
| May 08 | 3.0 | 2.7 | 2.8 | 2.9 | 3.3 | 3.3 | 4.1 | 4.1 | 3.2 | 3.1 |
| May 15 | 3.2 | 3.0 | 3.1 | 3.2 | 3.6 | 3.5 | 4.3 | 4.2 | 3.6 | 3.4 |
| May 22 | 3.7 | 3.2 | 3.3 | 3.3 | 3.5 | 3.6 | 4.1 | 4.2 | 4.0 | 3.6 |
| May 29 | 3.5 | 3.3 | 3.5 | 3.4 | 3.7 | 4.0 | 4.1 | 4.5 | 4.2 | 3.7 |
| Jun 05 | 3.5 | 3.4 | 3.4 | 3.4 | 4.0 | 3.9 | 4.4 | 4.5 | 4.4 | 3.8 |
| Jun 12 | 4.0 | 3.8 | 3.9 | 3.9 | 4.2 | 4.3 | 4.7 | 4.8 | 4.7 | 4.2 |
| Jun 19 | 4.3 | 3.8 | 3.9 | 4.0 | 4.1 | 4.2 | 4.7 | 5.0 | 4.8 | 4.2 |
| Jun 26 | 4.3 | 4.3 | 4.7 | 4.5 | 4.7 | 4.8 | 5.2 | 5.4 | 5.3 | 4.7 |
| Jul 03 | 4.7 | 4.5 | 4.9 | 4.6 | 4.9 | 5.0 | 5.0 | 5.4 | 5.1 | 4.9 |
| Jul 10 | 4.9 | 4.9 | 5.0 | 4.9 | 5.2 | 5.1 | 5.4 | 5.5 | 5.1 | 5.1 |
| Jul 17 | 4.9 | 4.8 | 4.9 | 5.0 | 5.1 | 5.1 | 5.7 | 5.7 | 5.2 | 5.1 |
| Jul 24 | 5.2 | 5.2 | 5.3 | 5.6 | 5.6 | 5.5 | 6.0 | 5.8 | 5.6 | 5.5 |
| Jul 31 | 5.1 | 4.9 | 5.1 | 5.4 | 5.4 | 5.2 | 5.8 | 5.8 | 5.5 | 5.3 |
| Aug 07 | 5.1 | 4.9 | 5.2 | 5.2 | 5.3 | 5.2 | 5.8 | 5.7 | 5.0 | 5.2 |
| Aug 14 | 5.4 | 5.3 | 5.3 | 5.7 | 5.8 | 5.5 | 6.1 | 6.0 | 5.7 | 5.6 |
| Aug 21 | 5.0 | 4.9 | 5.4 | 5.4 | 5.4 | 5.5 | 6.0 | 5.9 | 5.8 | 5.4 |
| Aug 28 | 5.1 | 5.0 | 5.1 | 5.5 | 5.5 | 5.5 | 6.1 | 6.0 | 6.0 | 5.5 |
| Sep 04 | 5.2 | 5.2 | 5.4 | 5.3 | 5.5 | 5.5 | 5.9 | 5.9 | 5.7 | 5.5 |
| Sep 11 | 5.3 | 5.2 | 5.5 | 5.5 | 5.5 | 5.4 | 5.9 | 5.9 | 5.6 | 5.5 |
| Sep 18 | 5.0 | 5.0 | 5.3 | 5.1 | 5.3 | 5.4 | 5.5 | 5.7 | 5.7 | 5.3 |
| Sep 25 | 4.8 | 4.5 | 4.9 | 4.9 | 5.1 | 5.2 | 5.4 | 5.7 | 5.3 | 5.0 |
| Oct 02 | 5.1 | 5.0 | 5.0 | 5.1 | 5.2 | 5.0 | 5.6 | 5.6 | 5.1 | 5.2 |
| Oct 09 | 5.1 | 5.0 | 5.1 | 5.1 | 5.2 | 5.3 | 5.7 | 5.8 | 5.7 | 5.3 |
| Oct 16 | 5.2 | 4.9 | 4.9 | 4.9 | 4.9 | 5.0 | 5.4 | 5.4 | 5.1 | 5.0 |
| Oct 23 | 4.7 | 4.5 | 4.8 | 4.7 | 4.8 | 4.8 | 5.3 | 5.5 | 4.6 | 4.8 |
| Oct 30 | 4.5 | 4.4 | 4.6 | 4.5 | 4.7 | 4.6 | 5.1 | 5.1 | 4.3 | 4.6 |
| Nov 06 | 4.3 | 4.0 | 4.4 | 4.2 | 4.3 | 4.3 | 4.7 | 4.8 | 4.3 | 4.3 |
| Nov 13 | 4.2 | 3.9 | 4.1 | 4.3 | 4.4 | 4.2 | 4.8 | 4.9 | 4.3 | 4.3 |
| Nov 20 | 4.2 | 3.9 | 4.0 | 3.9 | 4.0 | 3.7 | 4.7 | 4.6 | 3.7 | 4.0 |
| Nov 27 | 3.5 | 3.0 | 3.1 | 3.0 | 3.0 | 2.7 | 3.8 | 3.9 | 3.4 | 3.2 |
| Dec 04 | 4.0 | 2.8 | 2.5 | 2.9 | 2.5 | 1.8 | 2.9 | 3.3 | 1.8 | 2.7 |
| Dec 11 | 2.8 | 2.2 | 2.5 | 2.1 | 2.1 | 2.3 | 3.1 | 3.1 | 2.2 | 2.4 |
Calculating machinery needs
After you have found the average number of days that you can expect to be able to perform fieldwork, the minimum necessary daily machinery capacity can be computed. The formulas for this computation are:
acres worked per day = acres divided by days suitable for fieldwork
acres worked per hour = acres per day divided by working hours per day
For example, in southeast Missouri between April 3 and April 17, you can expect 6.1 days (3.0 + 3.1 days, from Table 1) suitable for fieldwork during that two-week period. If you have 1,000 acres of corn to plant, you need to be able to plant 164 acres per day (1,000 ÷ 6.1) to finish within two weeks under average circumstances. If the planter can be operated 14 hours per day, a planter large enough to plant 11.7 acres an hour (164 acres ÷ 14 hours) is needed.
Because these data are annual averages, the above example implicitly assumes a completion rate of about 50 percent. This means that in about half the years, less than 1,000 acres will be planted in the two-week period when planting at 11.7 acres an hour. This level of risk may not be acceptable to all operators.
Online tool for farmers
An online interactive tool called Corn Split Nitrogen is accessible from the Decision Dashboard section of the Useful to Usable (U2U) project’s website. This tool combines the fieldwork days data with a corn growth model and weather information to estimate the probability of successfully implementing a post-planting nitrogen application for corn production.
For more information
- Edwards, William. 2015. Farm Machinery Selection. Ag Decision Maker File A3-28. Iowa State University.
- Hanna, Mark. 2016. Estimating Field Capacity of Farm Machines. Ag Decision Maker File A3-24. Iowa State University.
Original authors
Ray Massey, Brent Carpenter and Scott Gerlt